
YouTube Channel Growth Strategy: What the Data Actually Supports
Most growth advice repeats numbers YouTube never published. Here is what the platform confirms, what large studies show, and how to read a video against your own channel baseline instead of chasing universal benchmarks.
Published September 4, 2026
TL;DR
- YouTube does not rank videos with a universal score. It predicts, per viewer and per surface, whether someone will choose a video, keep watching, and feel satisfied.
- The famous thresholds ("50% retention unlocks Suggested", "CTR is 40% of the algorithm") were never published by YouTube. They are invented.
- YouTube studied thousands of channels and found no correlation between upload gaps and growth. Frequency creates more chances; it is not a ranking bonus.
- Since 24 August 2026, a public view counts from the first frame. View counts are now an exposure metric, not a measure of interest.
- The one benchmark that survives scrutiny is your own channel's baseline: a video's views divided by the median of comparable videos at the same age.
Search "YouTube growth strategy" and you will find the same numbers repeated across hundreds of articles. A 50% retention threshold that supposedly unlocks Suggested. A CTR weighting expressed to the percentage point. A posting cadence the algorithm allegedly rewards.
None of these come from YouTube.
This article separates three things that usually get mixed together: what YouTube has actually confirmed, what large-sample studies show, and what is inference. Each claim below is labelled accordingly, because a strategy built on invented thresholds optimises for the wrong thing.
How YouTube recommends videos, by surface
There is no single algorithm. There are ranking systems per surface, and they use different signals.
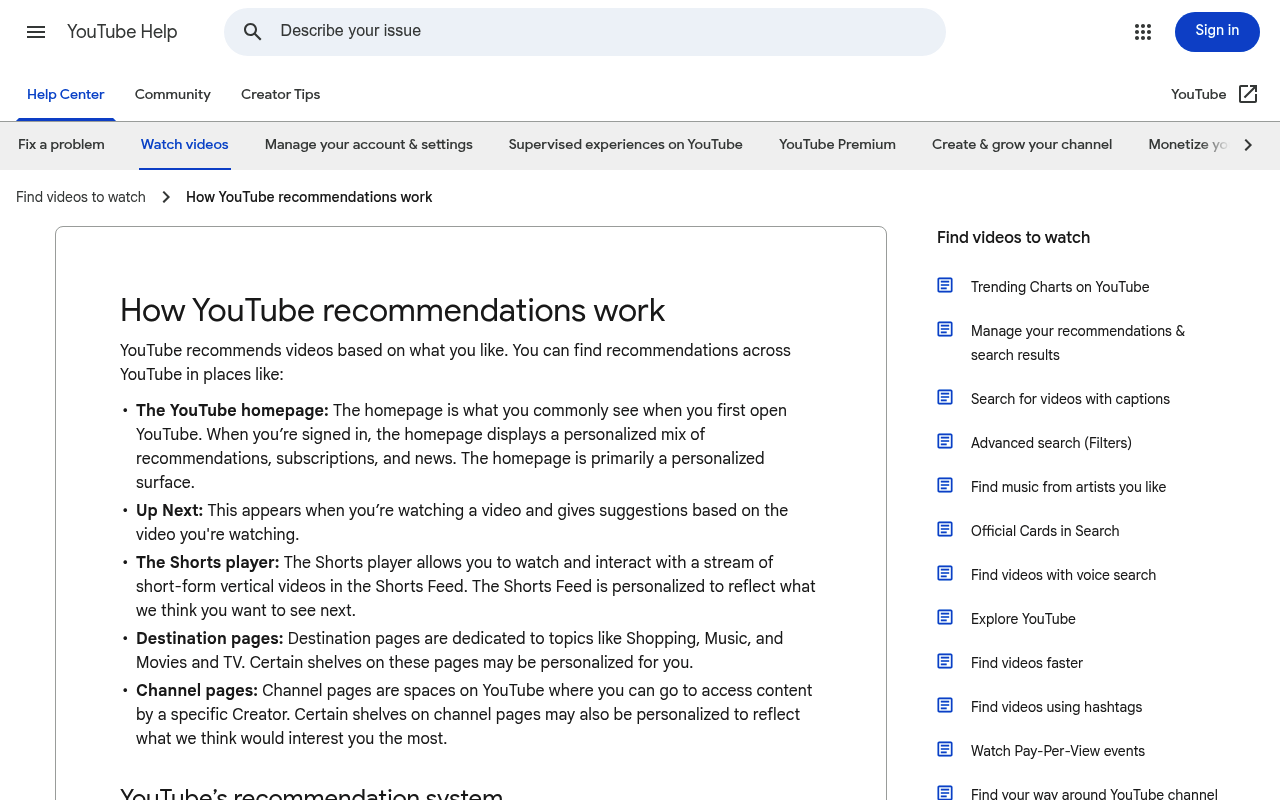
YouTube's own documentation on recommendation surfaces. Each has its own logic: a video can succeed on one and fail on another.
| Surface | What YouTube confirms | Practical reading |
|---|---|---|
| Home | Primarily personalised. Draws on watch history, subscriptions, new uploads, and videos watched by similar viewers. Watch history is the main personalisation signal. | The system is not asking whether your video is good. It asks whether this viewer is likely to choose and enjoy it. |
| Suggested / Up Next | The currently playing video is the main signal, plus personalisation from watch history. YouTube learns which videos get watched together. | Make videos that are a logical next watch after a specific video or topic. |
| Search | Matches title, description and video content against the query, plus which videos drive engagement for that query. Explicitly not ordered by view count. | Relevance first, then evidence that searchers choose and stay. |
| Shorts feed | Ranked on whether viewers choose to view or swipe past, average view duration, percentage viewed, likes, post-watch surveys, and previously enjoyed Shorts. | The opening frame decides the click. Retention decides the rest. |
YouTube groups these signals into three buckets it names openly: appeal (did they choose it), engagement (did they keep watching), satisfaction (did they value it). Its recommendation system learns from more than 80 billion pieces of signal information.
What YouTube has never published is a weighting. Not once.
Five claims that circulate as fact and are not
| Claim | Verdict |
|---|---|
| "CTR is 40% of the algorithm, retention is 30%" | Invented. No weights have ever been published. |
| "A video unlocks Suggested at 50% retention" | No such threshold exists. The 50%-at-30-seconds figure is a YouTube Studio diagnostic label for intros, not a ranking gate. |
| "YouTube tests your video on subscribers first" | Not supported. Recommendation audiences include subscribers, similar viewers and new viewers, decided per person. |
| "Taking a break kills your channel" | Contradicted by YouTube. It studied thousands of channels and found no correlation between break length and view changes. |
| "Tags matter for YouTube SEO" | Contradicted by YouTube. It calls tags "not important" for general discovery; they mainly help with common misspellings. |
The pattern is consistent: precise-sounding numbers with no source. A number without a source is not a benchmark, it is a rumour with decimals.
What upload frequency actually does
This is where the evidence gets genuinely interesting, because two credible sources appear to disagree.
YouTube's position: its analyses found no correlation between growth across uploads and the time between uploads. There is no confirmed cadence bonus.
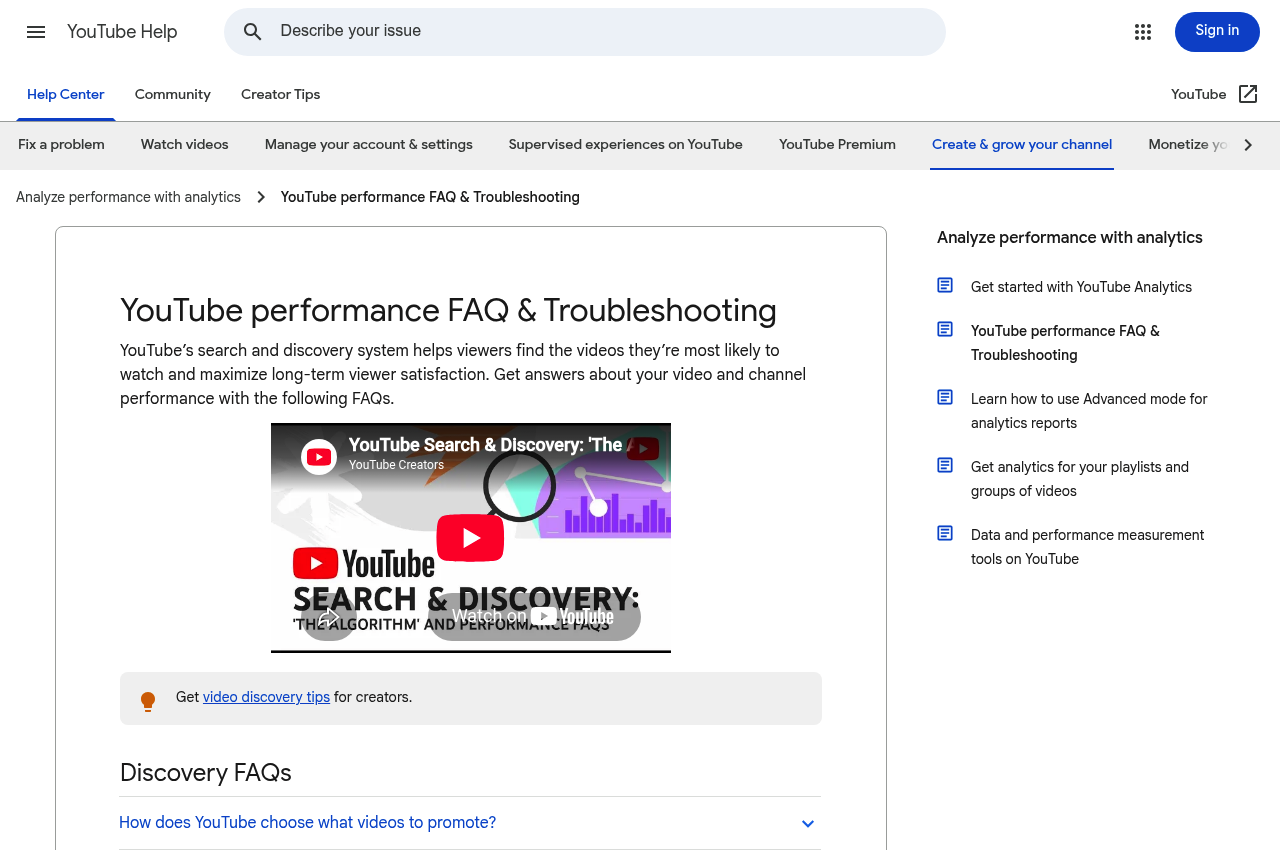
The same help page also dismisses two other persistent myths: publish time and tags.
vidIQ's study: analysing 10,210,278 channels with at least 1,000 subscribers, using uploads from April 2025 to March 2026:
| Uploads per month | Median monthly view growth | Median monthly subscriber growth |
|---|---|---|
| Fewer than 1 | 0.53% | 0.00% |
| 1–3 | 0.89% | 0.10% |
| 4–7 | 1.32% | 0.39% |
| 8–11 | 1.70% | 0.63% |
| 12+ | 2.18% | 0.91% |
Both are right, and the reconciliation matters more than either number.
The vidIQ figures are correlation, not causation. The authors say so explicitly. Channels publishing twelve times a month tend to have more resources, more practice and a clearer format than channels publishing once. Frequency is a marker of those advantages as much as a cause of growth.
The honest reading: more uploads mean more attempts, and more attempts mean more chances that one lands. That is a real mechanism. It is not the algorithm rewarding your calendar.
The metric that broke in 2026
On 24 August 2026, YouTube standardised public view counts across Shorts, long-form, podcasts and live. A view now counts from the first frame, including autoplay.
This quietly invalidated a lot of analysis. A public view no longer means someone chose to watch. It means a video started playing in front of someone.
| Metric | What it still tells you |
|---|---|
| Public views | Exposure. Little more. |
| Engaged views | Someone clicked, or watched past the opening seconds. |
| CTR by traffic source | Whether the packaging earns the click, on that surface |
| AVD + percentage viewed | Whether the video delivers on its promise |
Two earlier changes compound this. From 31 March 2025, a Shorts view counts on start or replay with no minimum watch time. From 15 July 2025, YouTube's "repetitious content" monetisation rule was renamed "inauthentic content", often misreported as an AI ban. It is not. Original AI-assisted work can still monetise; mass-produced template content is what carries risk.
If you are comparing a 2026 video against a 2024 video on public views, you are comparing two different metrics.
Testing packaging without guessing
YouTube now runs native A/B tests on up to three titles, thumbnails, or title-and-thumbnail combinations.
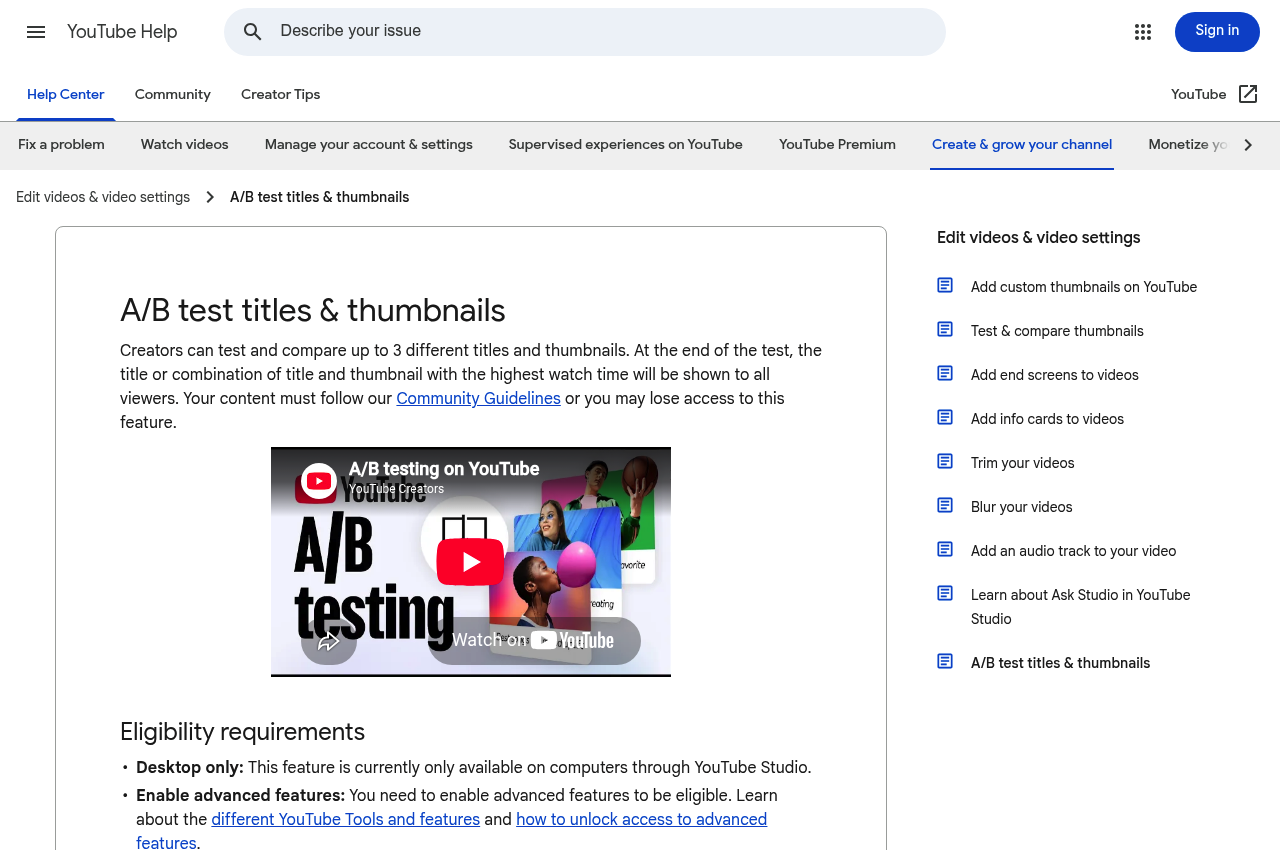
Native A/B testing picks the winner on watch time share, not on clicks.
That detail is the whole point. The test does not reward the thumbnail with the highest CTR. It rewards the one that generates the most watch time per impression, which means a misleading thumbnail that wins clicks and loses viewers will lose the test.
Three results are possible: Winner (statistically significant), Performed same, and Inconclusive. The last two are common and are not failures. YouTube's own guidance is to test variants with real creative differences, since near-identical options produce no signal. Not available for Shorts.
Read a video against its own channel, not against the internet
Here is the problem with every universal benchmark. A video with 50,000 views is:
- a disappointment for a channel that normally does 500,000;
- a breakout for a channel that normally does 3,000.
Raw view count bundles together channel size, active audience, video age, format, topic demand and seasonality. Comparing across channels compares all of those at once.
YouTube already applies this logic internally. Its "typical retention" band in Studio is built from your channel's last 10 videos of similar length. That is a channel-relative benchmark, not a platform-wide one.
How the outlier score works
| Component | Method | Why |
|---|---|---|
| Comparison set | Recent videos from the same channel, same format | Never compare Shorts against long-form |
| Age matching | Compare at equal age: 48 hours, 7 days, 28 days | A six-month-old video has had six months to accumulate |
| Baseline | Median, not mean | One past viral hit would drag a mean upward and hide every later breakout |
| Score | Views at age T ÷ median comparable views at age T | Expresses the break relative to that channel's normal |
A score of 1.0 is business as usual. 5.0 means five times what that channel normally does.
The median choice is not a detail. If a channel's last ten videos did 10k, 12k, 11k, 9k, 13k, 10k, 12k, 11k, 10k and 2,000,000 views, the mean lands at 210k and nothing will ever look like a breakout again. The median stays at 11k, and the next unusual video shows up immediately.
One caveat that most articles skip: channel-relative performance is an analysis method, not a ranking signal. YouTube has never said it recommends videos that hit 3× their channel median. The score is useful because it strips out channel scale and reveals an unusual audience response. It does not trigger anything.
A competitor's data supports the method
The 1of10 2025 report analysed more than 300,000 high-performing videos across 52,000 channels and 62.6 billion views, defining outlier score as video views divided by channel median views. That is the same calculation.
It associated outlier performance with shorter titles, emotional framing and visual clarity. Treat those findings carefully: the sample contained high-performing videos rather than a random draw, so it describes what successful videos look like, not what makes a video successful. Useful for generating A/B hypotheses. Not rules. Our title tester shows where a title gets truncated on each surface, which is the one variable you can check before publishing rather than after.
What documented growth cases have in common
These figures were published by YouTube. The explanations come from the creators, so treat them as documented examples rather than controlled experiments.
| Creator | Documented growth | What changed |
|---|---|---|
| zoeunlimited | 1M to 2M subscribers in two weeks; her top Short drove over 1.5M subscribers | A curiosity-driven Short with a strong subscribe CTA, on top of three years of near-weekly long-form uploads |
| Reza and Puja Khan | Up to 12,000 subscribers per day in peak weeks; reached 1.86M | One Short daily from January 2021, templated production, a visual change roughly every two seconds |
| Marina Mogilko | A "cost of giving birth" Short hit 18M views; a car-wash variation reached 30M | Found one outlier concept (surprising US costs), then iterated the structure across adjacent subjects |
| Morgann Book | 100k subscribers in six months, 1M in about 18 months | Narrowed to Shorts only, using retention drop-offs and Studio's Research tab to choose topics |
Mogilko's case is the clearest illustration of the method. She did not repeat the birth-cost video. She identified what made it work, the shock of an unexpected price, then rebuilt that structure around car washes, medical bills and other subjects. The transferable element was the premise, not the topic.
Note also what zoeunlimited's case actually shows. The two-week jump is real, and so are the three preceding years. Breakouts are usually visible acceleration on top of invisible groundwork.
Cases like these are published precisely because they are exceptional, which is worth keeping in mind if growth is a means to an income. The measured distribution is far flatter than the case studies suggest, and we set out what the sources actually say in how much YouTubers make.
A baseline dashboard worth keeping
| Metric | Compare against |
|---|---|
| Engaged views | Median of your last 10–20 comparable uploads, same age |
| CTR | Same traffic source: Browse, Suggested and Search separately |
| AVD and percentage viewed | Videos of similar length |
| First 30 seconds | Your own typical intro range |
| Returning viewers | Monthly audience, not subscriber count |
| Outlier score | Same-format, age-matched channel median |
Subscriber count deserves its place at the bottom. YouTube itself recommends unique viewers or monthly audience as a better read on active reach, because people subscribe to far more channels than they watch.
Where this leaves a strategy
Strip out the invented numbers and what remains is unglamorous but durable:
- Find ideas with demonstrated demand rather than guessing.
- Package for a specific viewer and surface. A Search video and a Browse video are different jobs.
- Deliver the promise immediately. A click you do not honour costs you the watch time that the test actually measures.
- Compare against your own recent, format-matched, age-matched baseline. Not against a number from an article.
- Publish as often as quality allows. More attempts, more chances. Not a bonus.
The last point is where the outlier score earns its place. It tells you which of your attempts broke the pattern. Applied to other channels, it tells you which formats are breaking out elsewhere before they reach your market.
Two follow-ups worth reading: what you can actually see in another channel's analytics, and which niches genuinely pay, where the same problem of invented numbers shows up in a different form. The method is applied to live data in our monthly rankings of top YouTube channels by country. For what the resulting views actually pay, see how much YouTube pays per view. And on the metric everyone still reads first, why a public subscriber count is never the real one.
FAQ
Does the YouTube algorithm favour channels that post daily?
No. YouTube studied thousands of channels and found no correlation between growth and the time between uploads. vidIQ's 10.2-million-channel study does show higher median growth for frequent publishers, but its authors state it is correlation, not causation. More uploads create more opportunities; the calendar itself is not rewarded.
What retention percentage do I need for YouTube to promote my video?
There is no threshold. The 50%-at-30-seconds figure circulating online is a YouTube Studio diagnostic label for intros, not a ranking gate. YouTube uses both average view duration and average percentage viewed, and compares against your own similar-length videos.
Why did my view count change meaning in 2026?
Since 24 August 2026, a public view counts from the first frame, including autoplay. Views are now an exposure metric. Use engaged views, CTR, average view duration and retention to judge whether people actually watched.
What is a good outlier score?
Thresholds like 2× or 3× are analyst conventions, not YouTube rules. A score of 1.0 means the video performed like a normal upload for that channel; 5.0 means five times its median. What matters is the comparison being fair: same channel, same format, same age.
Do Shorts hurt long-form recommendations?
No. YouTube states that Shorts performance does not negatively affect long-form recommendations. It also notes that Shorts viewers do not automatically become long-form viewers, which is a different problem.
Sources
- How YouTube recommendations work. YouTube Help
- Get discovered on YouTube. YouTube Help, upload frequency and tags
- A/B test titles and thumbnails. YouTube Help
- How Shorts are recommended. YouTube Help
- A change to how views are counted. YouTube Help, August 2026
- Response to creator questions about YPP policies. YouTube, July 2025
- vidIQ upload frequency study, 10,210,278 channels, April 2025 – March 2026
- 1of10 2025 outlier report, 300,000+ videos across 52,000 channels