
The Most Profitable YouTube Niches in 2026 (Measured Data, Not Guesswork)
Almost every niche ranking online confuses advertiser CPM with creator earnings. Here is what measured RPM data from 300 channels actually shows, why audience country matters more than niche, and how to judge a niche before entering it.
Published September 4, 2026
TL;DR
- Most "RPM by niche" tables are advertiser CPM multiplied by 55%. That calculation is wrong, and it inflates finance figures the most.
- In the best measured dataset available (300 channels, 3,595 channel-months), Education led at $10.22 RPM, not finance. The overall median was $2.30.
- Audience country moves earnings more than niche does: the same channel earned 12.4× more from US viewers than Indian viewers. For Shorts, the gap reached 41×.
- Shorts earn 3–14% of long-form RPM. You need roughly 11,000–34,000 Shorts views to match 1,000 long-form views.
- The profitable niches are rarely the highest-RPM ones. They are the ones where you can sell something beyond ads.
Search "most profitable YouTube niches" and you will find the same table everywhere: finance at $15–$30 RPM, tech around $10, gaming scraping the bottom. The numbers vary slightly between articles, which is odd, because most of them are recycling the same handful of sources.
Here is the problem. Almost all of those tables take an advertiser CPM, multiply it by 55%, and label the result "RPM". That is not how RPM works, and the error is not small.
This article uses measured data where measured data exists, labels estimates as estimates, and explains why the honest answer to "which niche pays best" is less useful than the question most creators should be asking instead.
The definitions that break most niche rankings
| Metric | What it actually means |
|---|---|
| CPM | What advertisers pay per 1,000 ad impressions, before YouTube's cut. Excludes every view where no ad ran. |
| Playback-based CPM | Advertiser cost per 1,000 monetised playbacks, each of which may carry several ads. |
| RPM | What the creator actually keeps, per 1,000 total views, including views that showed no ad at all. Also includes Premium revenue, memberships, Super Chat. |
These are YouTube's own definitions. The critical difference: CPM counts only monetised impressions, RPM counts all views.
So when an article tells you finance earns "$16.12 RPM", derived from a $29.30 CPM × 55%, it has silently assumed every single view carried an ad. In the measured data below, the median channel showed an ad on 53% of views. For tech channels, just 34%.
That assumption alone can double a published figure.
What measured RPM data actually shows
AIR Media-Tech published the strongest current dataset: 300 channels, 3,595 channel-months, May 2025 to May 2026, pulled from real Studio analytics rather than creator claims.
| Niche | Measured median RPM | P25–P75 range | Studio CPM |
|---|---|---|---|
| Education & Science | $10.22 | $2.31–$19.50 | $5.91 |
| Transport | $5.69 | $3.17–$9.81 | $5.88 |
| Lifestyle | $2.98 | $1.77–$5.24 | $5.32 |
| Entertainment | $2.43 | $0.88–$5.02 | $3.98 |
| Gadgets & Tech | $2.33 | $0.70–$3.71 | $5.73 |
| Food | $2.25 | $1.50–$3.11 | $4.04 |
| Gaming | $2.05 | $0.70–$3.62 | $4.05 |
| Business & Finance | $2.01 | $0.73–$5.17 | $4.84 |
| Health & Sport | $1.23 | $0.72–$1.53 | n/a |
Overall median: $2.30.
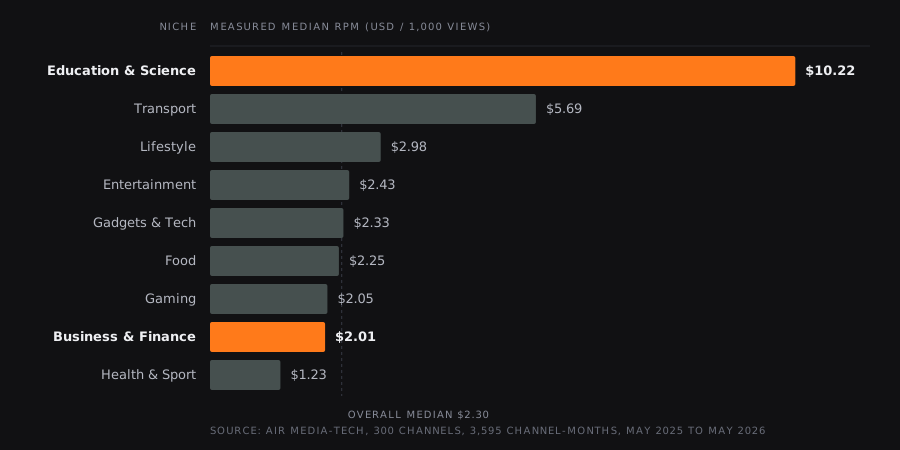
Measured RPM by niche. The niche every listicle crowns sits eighth.
Two things in that table should stop you.
Education leads, and finance does not. The niche that every listicle crowns as most profitable sits eighth on measured RPM. Education earns nearly five times more per view.
Education's RPM ($10.22) exceeds its CPM ($5.91). That looks impossible until you remember RPM includes memberships and Premium revenue, and that Education showed ads on 77% of views with 1.84 ads per monetised view, the highest fill rate in the sample. Tech, by contrast, monetised only 34% of views. Same advertiser interest, half the revenue.
The caveats, stated plainly: this is an AIR-partner sample, not a random draw from YouTube. It is not controlled for audience geography or format. Several categories (Business/Finance, Food, Transport, News) contain fewer than ten channels each, so treat those rows as directional rather than definitive. It remains the best measured data publicly available, which says something about the state of the field.
The variable that matters more than your niche
Here is the finding that reframes the whole question.
One How-To/Style channel, the same 22 videos, the same year, 927,972 views. Median CPM by viewer country, in euros:
| Viewer country | Median CPM | vs India |
|---|---|---|
| United States | €10.263 | 12.4× |
| United Kingdom | €6.526 | 7.9× |
| Germany | €5.526 | 6.7× |
| Brazil | €1.143 | 1.4× |
| Philippines | €1.048 | 1.3× |
| India | €0.826 | 1.0× |
Same channel. Same content. Same niche. A 12.4× spread, driven entirely by where the viewers were sitting.
For Shorts the gap is wider still. AIR's data across thousands of channels puts US Shorts RPM at $0.328 against $0.008 in India: a 41× difference.
Put those two datasets side by side and the conclusion is uncomfortable for niche rankings: the spread between the best and worst niche (roughly 8×) is smaller than the spread between the best and worst audience geography (12× to 41×).
A finance channel with an Indian audience can earn less per view than a gaming channel with a US audience. The niche tables never mention this, because it makes them far less useful.
Why advertisers pay differently
The niche differences that do exist are not arbitrary. They track a handful of mechanisms:
| Driver | Mechanism | Niches favoured |
|---|---|---|
| Customer lifetime value | A brokerage or B2B SaaS company can profitably spend far more to acquire one customer than a mobile game can | Finance, business, B2B tech, education |
| Purchase intent | "Best accounting software" viewers are closer to buying than viewers watching comedy | Finance, tech reviews, beauty |
| Advertiser competition | CPM rises when several banks or SaaS firms bid for the same audience | Finance and business highest |
| Ad load | Long videos with natural mid-roll breaks carry more ads: Education averaged 1.84 per monetised playback, Gaming 1.44 | Tutorials, education, long-form |
| Fill rate | Only 53% of views showed an ad at the median. Education hit 77%, Tech 34% | Varies enormously |
| Brand safety | Graphic, medical or political content may draw fewer eligible advertisers even with a valuable audience | Health, news, true crime penalised |
Fill rate deserves more attention than it gets. Two channels with identical CPMs can earn twice as differently based purely on how often an ad actually runs.
Shorts do not pay like long-form, and it is not close
AIR analysed 274 mixed-format channels across 3,044 channel-months:
- Shorts RPM runs at 3–14% of long-form RPM in almost every niche
- Typical Shorts RPM: $0.07–$0.20
- You need roughly 11,000 to 34,000 Shorts views to match the revenue of 1,000 long-form views
A gaming example from the same data: $0.17 Shorts RPM against $1.79–$3.17 long-form.
The mechanism is structural, not a penalty. Shorts revenue is pooled by country, music licensing is deducted first, and creators keep 45% of their allocated pool, against 55% of net Watch Page ad revenue for long-form.
Shorts are a reach and funnel product. Treating them as a direct ad-revenue substitute is the mistake.
The rankings change when you count everything
AdSense is one revenue stream, and for most profitable channels it is not the largest. Sponsorship rates by niche, expressed as CPM per 1,000 expected views:
| Niche | Sponsorship CPM | At 50,000 views |
|---|---|---|
| Finance / Business | $40–$80 | $2,000–$4,000 |
| Tech | $30–$60 | $1,500–$3,000 |
| Health / Fitness | $25–$45 | $1,250–$2,250 |
| Education | $20–$40 | $1,000–$2,000 |
| Beauty / Fashion | $20–$40 | $1,000–$2,000 |
| Travel | $20–$40 | $1,000–$2,000 |
| Food | $18–$35 | $900–$1,750 |
| Gaming | $10–$25 | $500–$1,250 |
| Entertainment | $10–$20 | $500–$1,000 |
These are market-pricing bands from tracked sponsored videos, not audited contracts.
Note what happens to finance here. Weak on measured AdSense RPM, strongest on sponsorship. A finance channel doing 50,000 views per video can earn $2,000–$4,000 from a single integration. That is more than most channels earn from ads in a month.
A reality check on the market, though: CreatorIQ analysed direct payments to 14,400 creators in 2025. Median payment: $3,000. Mean: $11,400. The top 10% captured 62% of all payment volume. Sponsorship money is real and heavily concentrated.
Which niches earn most off-platform
| Niche | Strongest non-ad revenue | Assessment |
|---|---|---|
| Business | SaaS referrals, consulting, courses, B2B sponsorship | Strongest overall model, built on high-margin services |
| Finance | Brokerage leads ($50–$200 per qualified lead), newsletters, communities | Exceptional, heavily regulated |
| Education | Courses, tutoring, certifications, memberships | Already leads on RPM, then adds high-margin IP |
| Tech | SaaS recurring commissions (15–50%), hardware affiliate | Very high purchase intent |
| Beauty | Affiliate commerce (10–18%), own product lines | Outranks its moderate ad RPM: content is directly shoppable |
| Gaming | Memberships, donations, merch, publisher deals | Weak ads, strong communities at scale |
Memberships are the one figure YouTube states plainly: creators receive 70% of recognised membership revenue after taxes and fees.
This is not a fringe pattern. YouTube's own 2024 data shows that among Partner Program channels earning five figures or more, over half made money from sources other than ads and Premium, a point we take apart in how much YouTubers actually make.
What changed in 2025–2026
| Date | Change | Consequence |
|---|---|---|
| 15 July 2025 | "Repetitious content" renamed "inauthentic content" | Widely misreported as an AI ban. It is not. Original AI-assisted work still monetises; mass-produced template content is the risk. |
| Current (Sept 2026) | YPP ad tier: 1,000 subscribers + 4,000 long-form watch hours, or 10M Shorts views in 90 days | These are today's thresholds, not the 2027 figures circulating |
| 1 February 2027 | New applicants will need 8,000 qualified hours or 20M Shorts views | Existing members are not removed for missing the new bar |
That February 2027 change matters for anyone choosing a niche now. The barrier to first ad monetisation roughly doubles for new applicants, which shifts the calculus further toward niches where you can sell something before AdSense ever switches on. The full list of conditions, including the ones that are not numbers, is in YouTube monetization requirements.
Saturation: what can honestly be claimed
Tubular Labs data across nearly 30 million uploading channels, trailing twelve months:
| Category | Channels uploading |
|---|---|
| Pop culture / entertainment | 5.3M |
| Movies / TV | 3.1M |
| Gaming | 3.0M |
| Music | 2.2M |
| Science / Tech | 223K |
| Food | 159K |
Crowded does not mean unprofitable. Entertainment has enormous demand alongside its enormous supply. But the ratio between the top and bottom rows is instructive: 33× more channels compete in pop culture than in food.
Beyond that, honesty requires admitting the limits. Public datasets on niche saturation are either too broad (top-level categories that lump wildly different content together) or too small to generalise. Anyone publishing a confident "these five niches are underserved in 2026" list is estimating.
The evaluation that does work happens at the subtopic and audience-country level, not the category level. "Finance" is not a niche. "Retirement planning for UK expats" is.
A defensible ranking
Ordered by total business potential rather than AdSense alone:
| Rank | Niche | Reasoning |
|---|---|---|
| 1 | Business | Highest sponsorship CPM plus consulting, SaaS and course economics |
| 2 | Education | Best measured RPM ($10.22), highest ad fill, plus course and membership potential |
| 3 | Finance | Exceptional lead values and sponsorship rates; heavy regulation |
| 4 | Tech | Strong sponsors and recurring SaaS commissions; poor ad fill drags AdSense |
| 5 | Health | Valuable advertisers and products, offset by policy and credibility risk |
| 6 | Beauty | Moderate ads, strong affiliate and own-brand commerce |
| 7 | Travel | Good affiliate values, high production cost, strongly seasonal |
| 8 | Food | Moderate across the board, decent product potential |
| 9 | Gaming | Low yield per view, enormous scale, strong community monetisation |
| 10 | Entertainment | Lowest direct yield, highest competition; needs mass scale |
For AdSense alone, that order changes: Education first, and the widely repeated claim that finance universally earns $15–$30 RPM rests on small, Tier-1-heavy disclosures rather than any representative 2026 dataset.
The question worth asking instead
"Which niche is most profitable" has a defensible answer, and it is not very actionable. The P25–P75 spread inside a single niche is often wider than the gap between niches. Gaming ranges from $0.70 to $3.62, a 5.2× spread within one category.
Which means the niche you pick explains less about your earnings than how well you execute inside it, and where your viewers live.
The more useful question: within a niche, which formats are actually breaking out right now? That is measurable. A video pulling five times its own channel's median is showing you a format working, independent of niche averages, channel size, or any published RPM table.
Look for that pattern in a market other than your own, and you get the same signal before it becomes obvious locally.
That method is set out in full in our guide to YouTube channel growth strategy, and the practical side, what you can actually measure on a channel that is not yours, in how to see YouTube analytics for other channels. Our rankings of top channels by country apply it month by month, market by market. The per-view side of the question, and why no fixed rate exists, is set out in how much YouTube pays per view. To put your own numbers through it, use the revenue calculator.
FAQ
Which YouTube niche has the highest RPM?
In the best measured dataset available (300 channels over 12 months), Education & Science leads at $10.22 median RPM, well ahead of the overall $2.30 median. The commonly repeated claim that finance leads comes from CPM figures multiplied by 55%, which overstates earnings because it assumes every view carried an ad.
Why is my RPM lower than the published figures for my niche?
Most likely audience geography and ad fill. The same content earned 12.4× more from US viewers than Indian viewers in a controlled single-channel study. And only 53% of views showed an ad at the median across all niches, and for tech channels only 34%.
Do Shorts pay as well as long-form videos?
No. Measured across 274 channels, Shorts RPM runs at 3–14% of long-form, typically $0.07–$0.20. You need roughly 11,000–34,000 Shorts views to match the revenue of 1,000 long-form views. Creators keep 45% of their allocated Shorts pool against 55% of net long-form ad revenue.
Is gaming a bad niche because of low CPM?
Not necessarily. Gaming has weak ad yield per view but enormous audience scale and strong membership, donation and merchandise revenue. The measured spread within gaming ($0.70 to $3.62 RPM) is wider than the gap between gaming and several higher-ranked niches.
Did YouTube ban AI content from monetisation in 2025?
No. The July 2025 update renamed "repetitious content" to "inauthentic content" and clarified that repetitive, mass-produced material has always been ineligible. YouTube states that AI-assisted channels can monetise if the content is original and compliant.
Sources
- Ad revenue analytics: CPM and RPM definitions. YouTube Help, March 2026
- YouTube Partner Program eligibility. YouTube Help
- Shorts monetisation policy. YouTube Help, August 2026
- YPP updates and 2027 eligibility changes. YouTube, August 2026
- Channel memberships revenue share. YouTube Help, July 2026
- Real RPM data from 300 channels. AIR Media-Tech, July 2026
- Shorts RPM vs long-form. AIR Media-Tech, June 2026
- CPM by viewer country, single-channel study. updated June 2025
- State of Creator Compensation. CreatorIQ, 14,400 creators
- Most competitive YouTube niches. TubeBuddy / Tubular Labs